
ProVue - Advanced JD Edwards Monitoring
ProVue Advanced Monitoring for JD Edwards is designed to bring power and simplicity to the process of monitoring your JD Edwards EnterpriseOne (E1) landscape. ProVue lets you go beyond monitoring the OS and network level metrics for E1 servers. It enables you to dive deeper into the inner working of E1. ProVue monitors in real-time kernel metrics, UBE performance, log files, JVM performance, end-user experience and provides proactive customizable alerts. ProVue also stores all metrics for historical searches, letting you go back in time when troubleshooting issues.
By leveraging the computing resources of Oracle Cloud Infrastructure (OCI) for hosting ProVue servers, customers are assured of top-notch performance and 24x7 access to the portal.
Benefits
Reduced Incident Resolution Time
With all essential and related information provided on a single pane of glass and the ability to traverse multiple servers and hundreds of log files almost instantaneously, a CNC administrator can quickly solve the problem at hand.
Proactive Monitoring
Reduce unexpected downtime by identifying and resolving issues before they impact the business with ProVue constantly monitoring the E1 landscape.
Flexible
Built for JDE, but flexible enough to monitor non-JDE systems, third party integrations, or to incorporate your existing monitoring scripts into its data feed.
Data-Driven Planning
Historical and real-time data points are stored for a minimum of 12 months which helps in making an informed decision when planning for JDE server expansion, migrations, or upgrades.
Detailed User Insights
Real-time end user behavior analytics to determine usage patterns, peak loads, most used applications, and historical sessions. Go from running surface tests from a single machine to capturing results from your entire JDE user base.
Schedule a demo today

Enhancing JDE ERP Monitoring with ProVue

Optimizing Multi-regional JD Edwards Performance with ProVue for a Global Industrial Gas Major

Birlasoft Solution Achieves Oracle Validated Integration with JD Edwards EnterpriseOne Expertise for Delivering Proven, Repeatable Integration
Why invest in ProVue?
- Reduce mean solution time
- Avoid incident avalanches
- Use historical data for future planning
- Get detailed insights into user experience
- Easily identify root cause from across all layers of the application
- Move from reactive to proactive monitoring
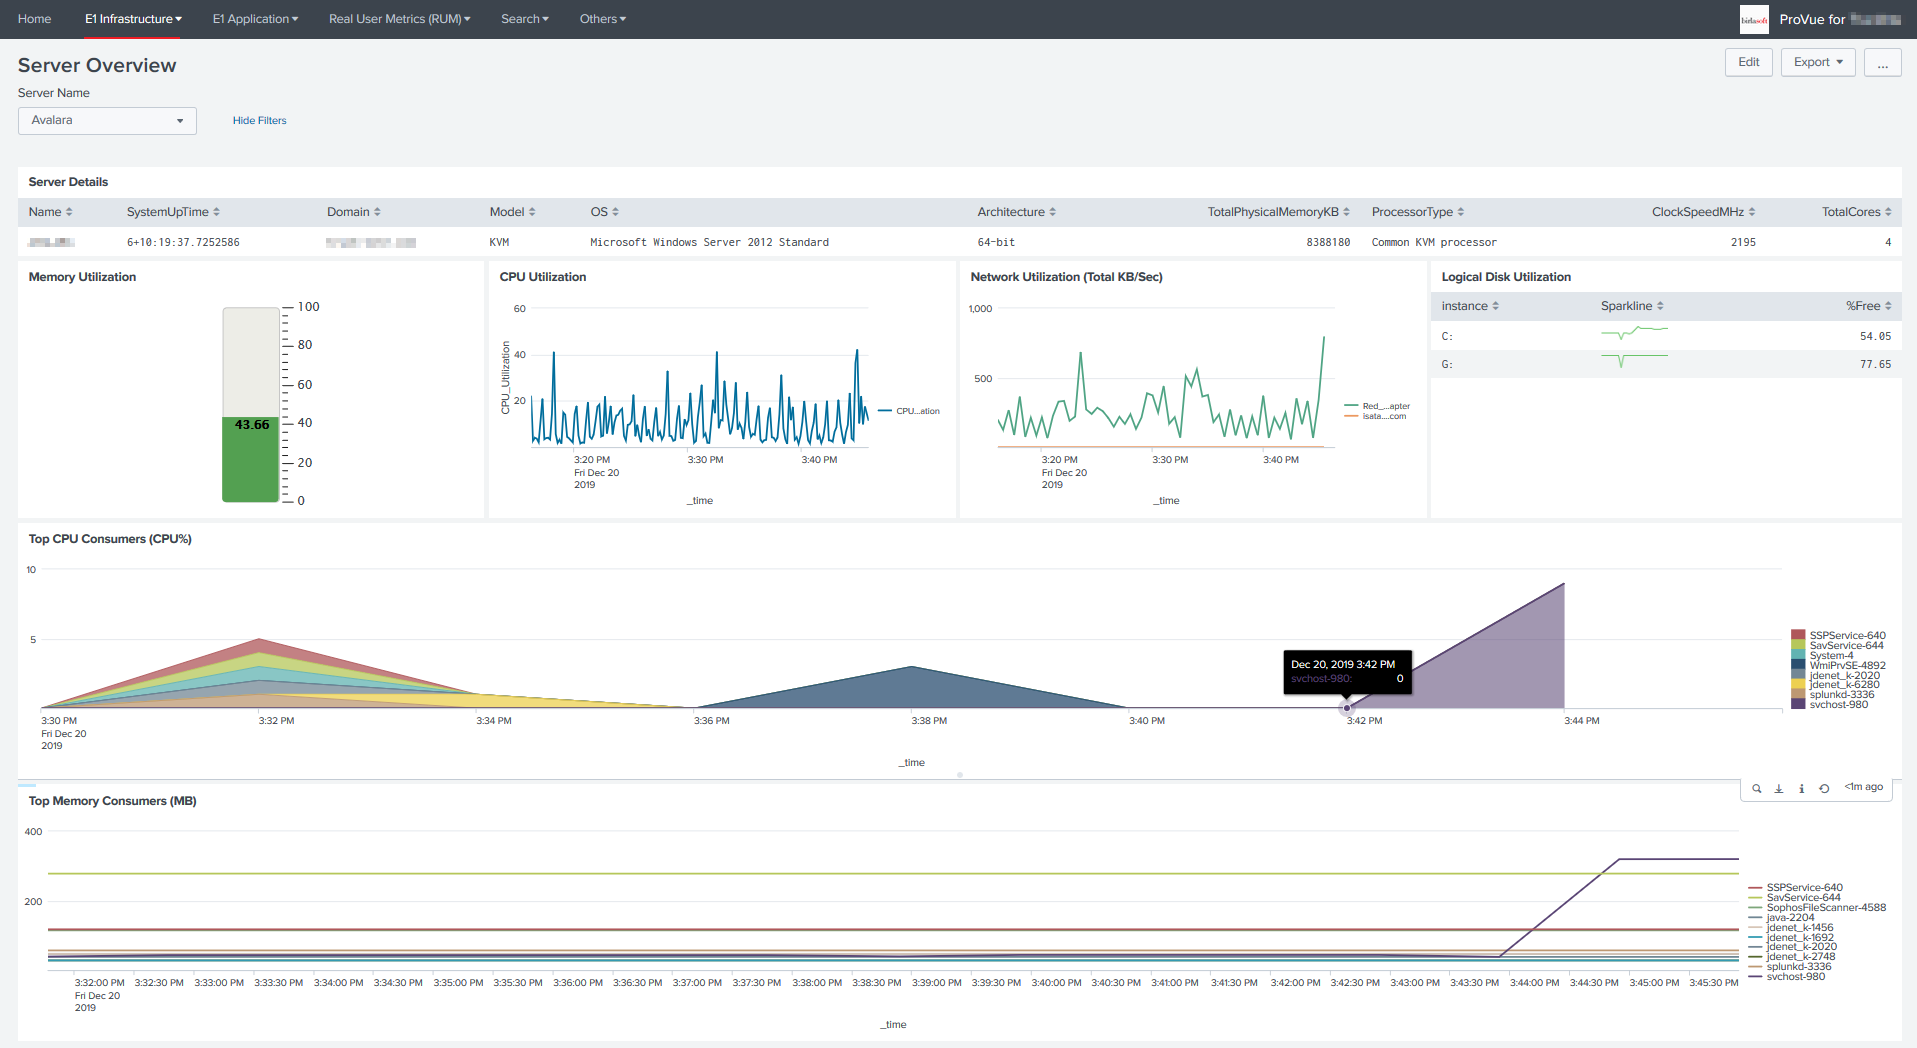
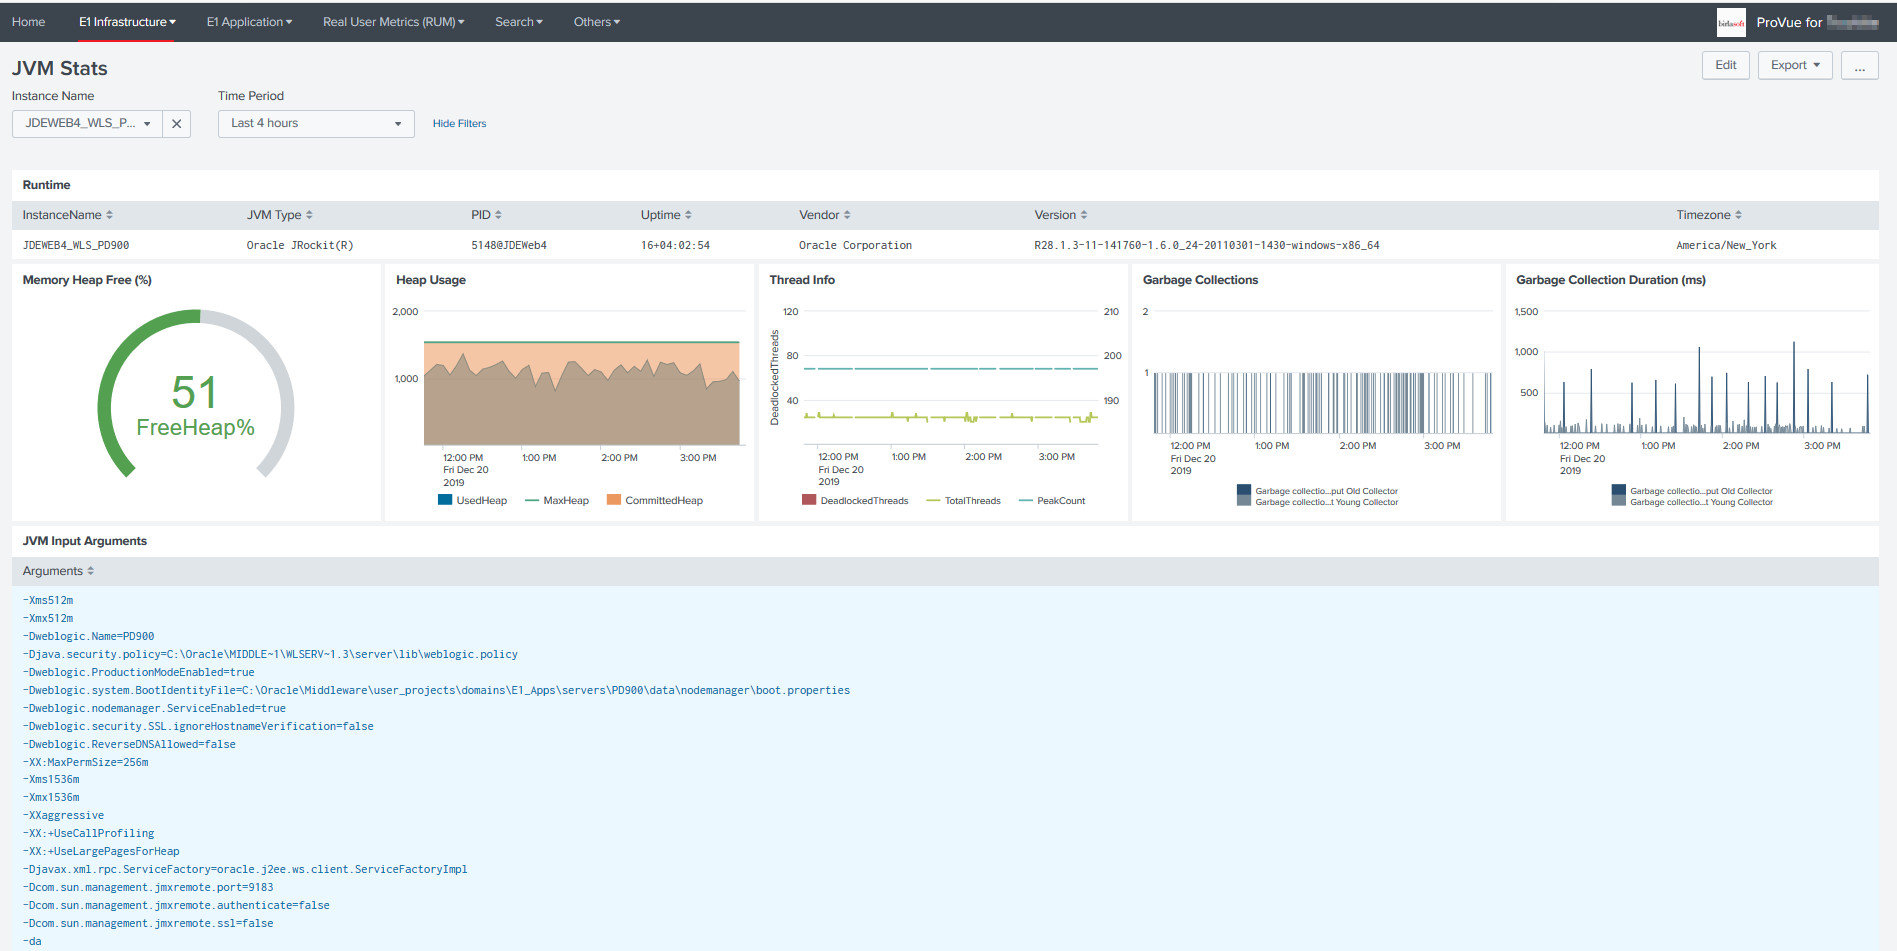
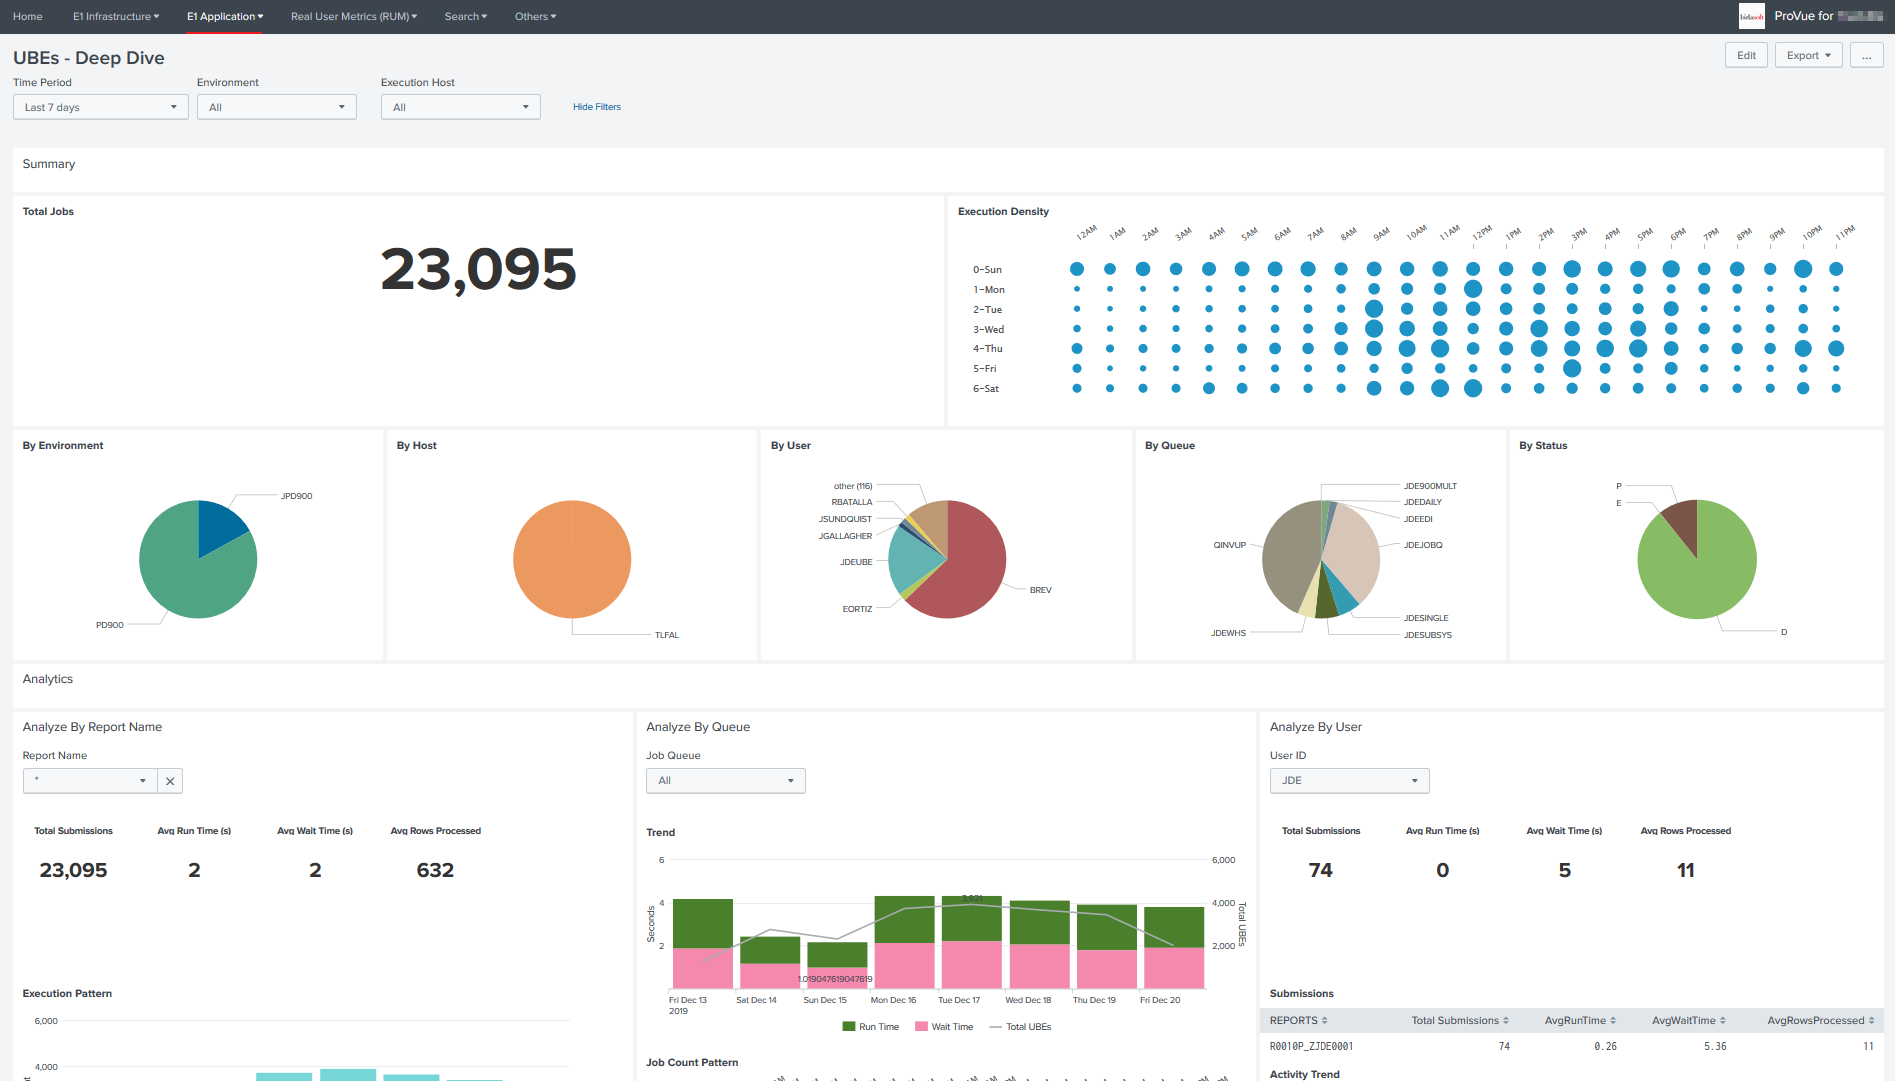
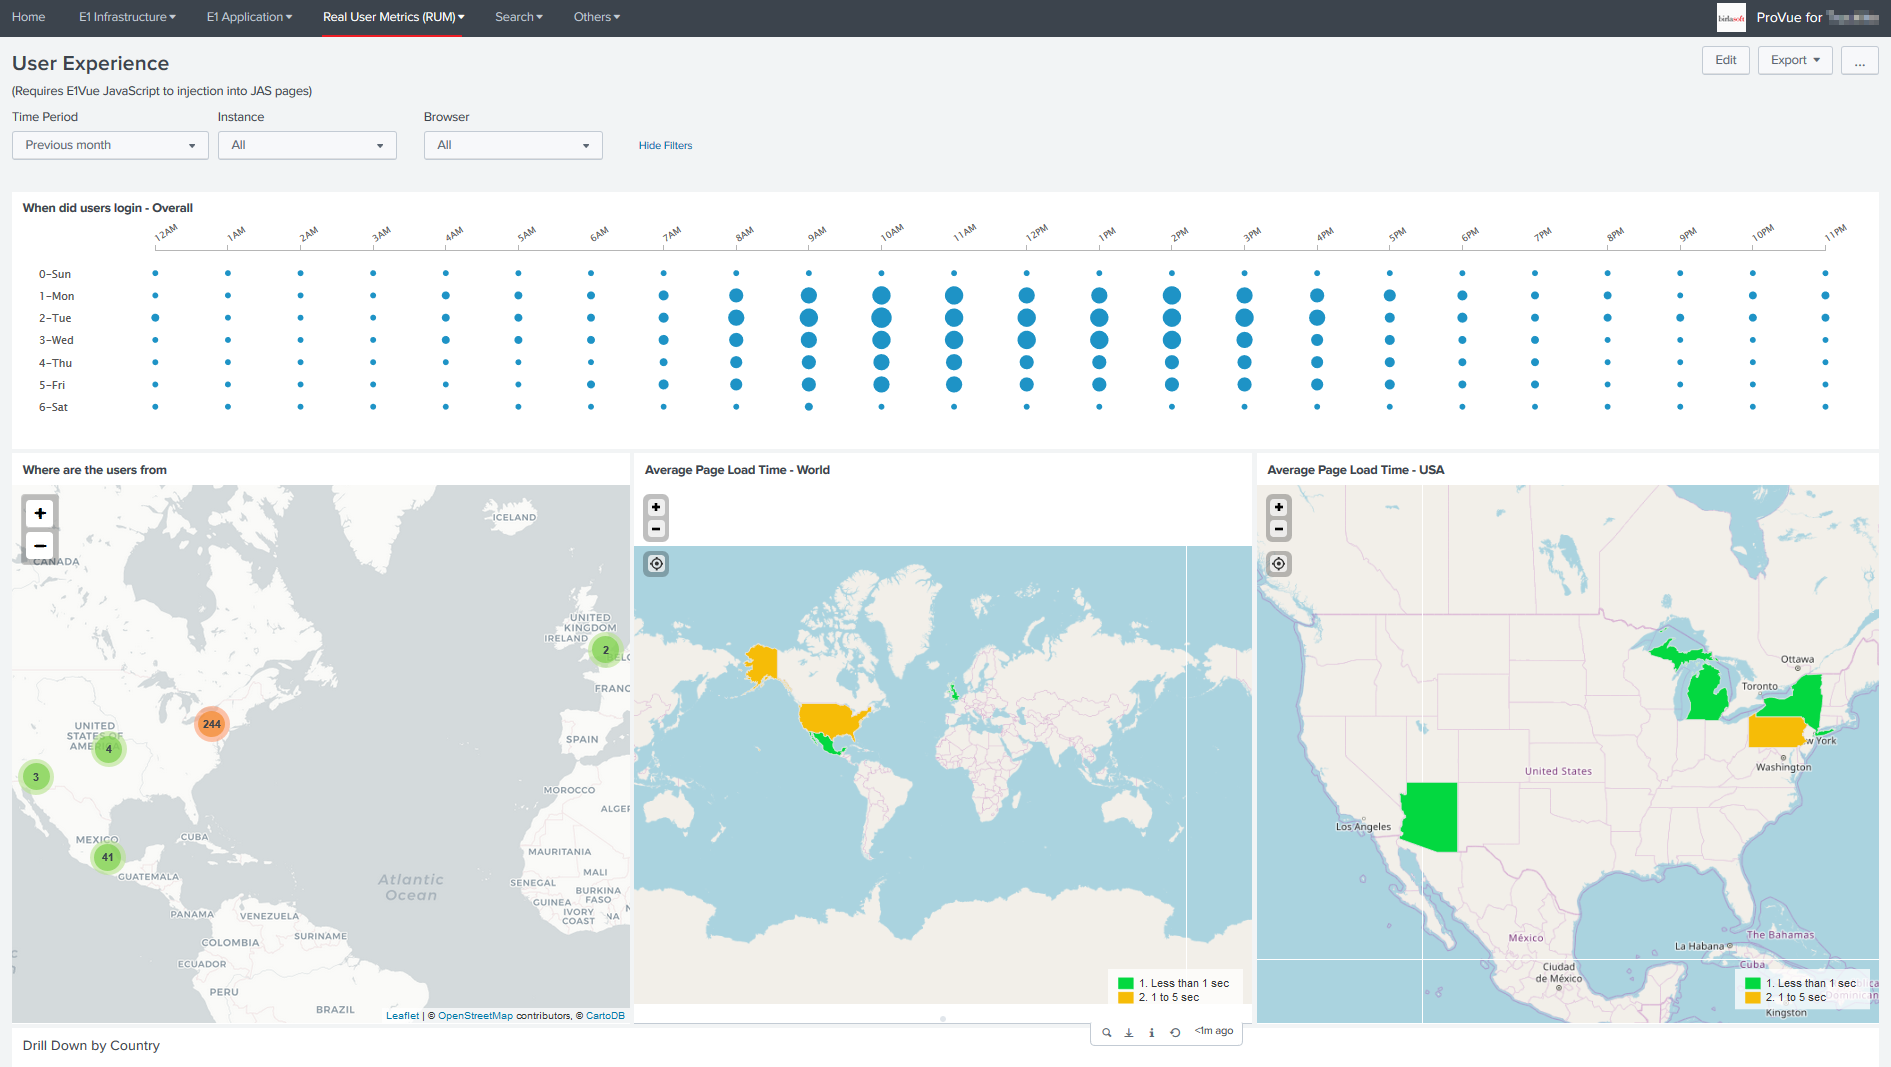
ProVue Screenshots
Our experts deliver superior services and IT innovations for better business outcomes.
Want to know more?
Want to know more?
FAQs
ProVue application monitoring tool collects machine data generated by your JD Edwards application and servers. This includes application server logs, server metrics, JVM metrics, database metrics batch job metrics, and real user monitoring (RUM) metrics. All this machine data is collected by ProVue agents and sent to a forwarding server installed on your data center itself which then streams to the hosted ProVue Infrastructure through a secure site-to-site IPSec VPN tunnel over HTTPS. ProVue does not monitor, track, collect or send any JDE business/transactional data.
The ProVue servers are hosted on Oracle Cloud Infrastructure with a high-availability multi-tenancy architecture. The data that is streamed to ProVue servers from your on-prem ProVue forwarder is indexed and stored in a proprietary format on encrypted block volumes.
Even though ProVue works on a multi-tenancy model with multiple customers accessing the same servers, multiple layers of security and segregation are built in. Every customer gets their own instance of the ProVue application, and they only have access to their instance of the application. This application, in turn, has access only to the indexes that pertain to that customer. The indexes for each customer are stored in separate encrypted block volumes. So, there is no chance of a customer’s application accidentally seeing another instance’s data. Whenever a customer stops using ProVue, the indexes, block volumes, and their instance of the application are deleted.
Yes, it is possible to monitor non-JDE services/servers in ProVue. Please contact us for more details on how it can be achieved.
No, ProVue does not monitor JDE debug logs under the default configuration. If you need to monitor them, please contact us, and we can set them up for you.
No, all dashboards and queries run on top of the indexed data that is already available on the ProVue servers. Under no circumstance does it need to connect to the on-prem servers.
RUM captures performance metrics from inside a user’s browser. It can identify and track each user session, including entire click paths (applications that a user opens in JDE and actions performed on those). This information is needed to monitor performance, provide high-quality service monitoring, and quickly resolve issues when problems are detected.
RUM mainly captures JDE URLs, IP addresses, and usernames as required for application performance management. It tracks click paths but does not track personal data or any other data that a user enters on JDE screens. This is because ProVue is focused on user behavior, response times, and service communication, not specific input values.
If Birlasoft is providing JD Edwards (JDE) Managed Services support for you, we use the data collected by ProVue to provide a higher level of support, including proactive monitoring, faster issue resolution, etc. If we are not providing JDE Managed Services support for you, we do not use the data collected by ProVue for any means.
Yes, the instance of the ProVue app that you are subscribed to, the indexes, and the block volumes will be deleted upon termination of ProVue subscription.