
Robust solutions to help buyers manage their portfolio of parts, costs, risk, and the supply network
Opportunity Management
- Learn if you are paying too much for parts
- Uncover which buyers have the largest opportunity to save you money
Historical Look Back
- Analyze pricing and demand trends
- Graphically assess your spending history
- Compare your suppliers price increases over time
Material Movement
- Determine if the length of your supply network is worth the savings
- Assess your logistical risk for critical parts
- Learn if supplier consolidation will save on shipping costs
Pricing Forecasting
- Accurately forecast the price of a part several years from now
- Determine what regions will be the most competitive in the future
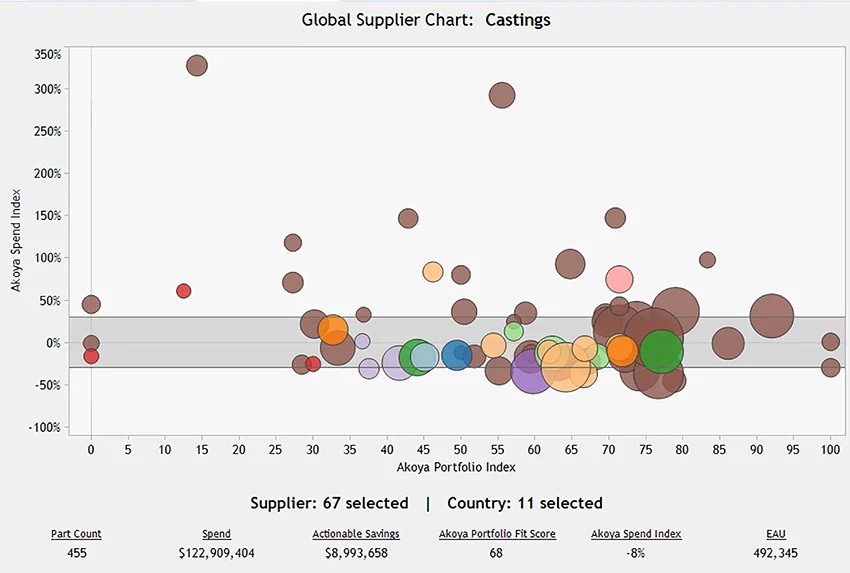
Global Supplier Chart
Quickly assess one country's suppliers, spend, part count and annual EAU. Easily compare and contrast supplier details.
See your spend by geographic region and part category with the Part Category Spend Map. This solution visually maps your spend, part count, supplier count and facility count by part category geographically, graphically shows you your purchasing data to help you make smarter business buying decisions. You can also view this map by part category or by date.
Dig into the details of your suppliers, comparing and contrasting them with the Supplier Detail Chart. This chart lets you see your suppliers, sorted by part category. It also details the number of parts you buy from them, your total spend with them, the supplier's region and the number of defective parts per million, on time delivery performance and other supplier based metrics.
Assess the suppliers for each of your facilities with the Supplier Count by Receiving Facility Chart. Find out how many different suppliers are being used at each of your facilities and how much you spend with suppliers for that facility.
Get rich details about your facilities' suppliers with the Part Sourcing Facility Detail Chart. With this chart, you can see each of your facilities' suppliers, supplier spend, supplier count and part count per source country. You can sort this chart by part category, date range or receiving facility.
Buyer Summary Chart
Quickly see what each of your buyers spend.
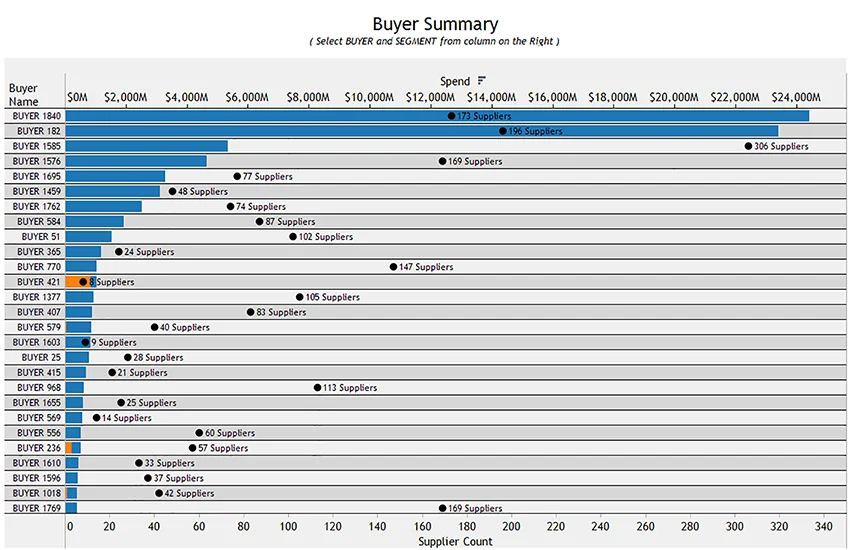
Visualize part send, number of suppliers and amount of spend per buyer
letting procurement managers compare buyer workload and performance and set appropriate savings goals per buyer. Use real data to decide if some of your buyers should be managing fewer - or more - suppliers. Compare the number of defective parts per million across buyers. Notice atypical changes in the supply network so you can proactively manage potential supplier issues before they become real problems. Identify norms and atypical parts, suppliers and prices so you can advise your buying team on potential savings opportunities or risks.
Drill down to see even more about each buyers' effectiveness with the Buyer Detail Chart.
By specific buyer, view a list of suppliers, part count, supplier region, spend and defective parts per million so you can advise each of your buyers on savings opportunities, risks and workload effectiveness.
Quickly get visibility into your buyers’ performance with the Buying Effectiveness Solution.
This management tool gives you analyzed data based on real time savings by buyer. You can assess part spend, number of suppliers and amount of spend per buyer, compare buyer workload and performance and set appropriate savings goals per buyer.