
| Details | Unit | Total | Engineering | Business IT |
| Revenue | $ M | 149 | 70 | 79 |
| Revenue | ₹ M | 10,613 | 4,976 | 5,637 |
| Reported EBITDA | ₹ M | 1,382 | 640 | 742 |
| Merger/Demerger Expenses | ₹ M | 3 | 1 | 2 |
| Operational EBITDA | ₹ M | 1,385 | 641 | 744 |
| Reported EBITDA % | % | 13.0% | 12.9% | 13.2% |
| Operational EBITDA % | % | 13.1% | 12.9% | 13.2% |
| Details (YTD Q3FY19) | Unit | Total | Engineering | Business IT |
| Revenue | $ M | 452 | 200 | 252 |
| Revenue | ₹ M | 31,540 | 13,916 | 17,624 |
| Reported EBITDA | ₹ M | 4,076 | 1,542 | 2,534 |
| Merger/Demerger Expenses | ₹ M | 283 | 94 | 189 |
| Operational EBITDA | ₹ M | 4,359 | 1,636 | 2,723 |
| Reported EBITDA % | % | 12.9% | 11.1% | 14.4% |
| Operational EBITDA % | % | 13.8% | 11.8% | 15.4% |
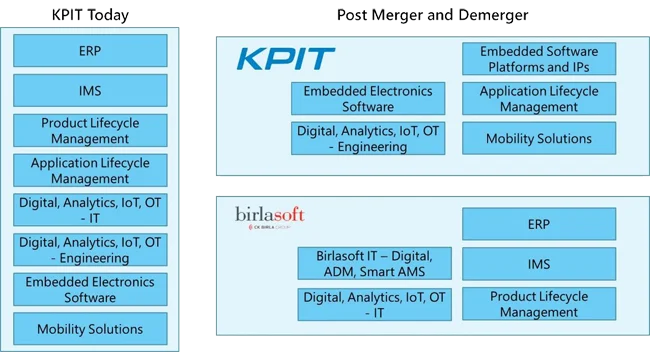
The merger of KPIT and Birlasoft will create a USD 700+ Million entity which will immediately demerge into two separate companies:
- KPIT Technologies (USD 270+ Million revenue company, post-merger), a global leader in Automotive Engineering and Mobility Solutions, which will evolve from the existing Engineering business of KPIT.
- Birlasoft (a USD 475+ Million revenue company, post-merger), a new Digital Business IT Services company, focusing on the mid-tier IT space formed by combining Birlasoft with the KPIT's IT business
The Mumbai Bench of NCLT vide its order dated November 29, 2018 has approved the composite scheme. The written order was received by KPIT on December 18, 2018. The appointed date for the scheme is January 01, 2019 and the effective date is January 15, 2019. Thus, Q4FY19 will be the first full quarter of independent quarterly reporting by KPIT (KPIT Engineering Business) and Birlasoft (Birlasoft + KPIT IT Business).
In view of the NCLT approval, the major milestones for the effectiveness of the NCLT approval are as follows:
| Sr. | Key Milestone / Action | Likely Date / time-period |
| 1. | KPIT Investor Conference Call for Q3FY19 | January 16, 2019, 1600 hrs. |
| 2. | Record Date for issuing KPIT shares to Birlasoft Promoters as a consideration for merger of Birlasoft into KPIT. | January 15, 2019 |
| 3. | Allotment of Shares to Birlasoft Promoters | January 18, 2019 |
| 4. | KPIT (to be renamed as Birlasoft) shares to start trading ex-engineering | January 24, 2019 |
| 5. | Record Date for issuing KPIT Engineering (to be renamed as KPIT Technologies) Shares* to every shareholder of KPIT (to be renamed as Birlasoft) in the ratio of 1:1 | January 25, 2019 |
| 6. | KPIT Technologies name change to Birlasoft (India) Ltd. | 1st week of Feb, 2019 |
| 7. | KPIT Engineering to change name to KPIT Technologies Ltd. | 2nd week of Feb, 2019 |
| 8. | KPIT Technologies Ltd. (Engineering) to get listed on NSE and BSE | March 2019 |
IES SBU contributed 23.78% of the total revenue for the quarter. There has been a larger secular movement towards cloud adoption in Oracle and JDE and thus a proportionate movement away from traditional pool of services resulting in softness even this quarter, in terms of overall growth. To couple with this, there was a loss of around 1.5 billing days during the quarter. This resulted in a sequential decline of 2.4%.
Growth in IoT and Big Data with focus on smart data are the continuing trends. Datasets are now being designed to drive elements like security, compliance, governance etc. KPIT is being viewed by Oracle as the go to Cloud PDH partner. Traction with Oracle in Energy sector is improving. The traction seen in new age technologies, fresh upgrades, Multi-cloud models such as JDE cloud migration to OCI, AWS, and Azure as well as good reception of digital assistants in the ERP space such as Infor, augurs well for growth of our offerings in these areas.
SAP SBU contributed 14.28% of the total revenue for the quarter. There has been a considerable decline in sequential revenues of 18.1% owing to loss of billing days (1.5 billing days lower) and closure of the largest project delivered by us, during the quarter, resulting in lower billing for the quarter. With the quarter behind us now, we are ready for the future. We are fully aligned to SAP’s areas of growth, investments and opportunities in its ecosystem. We are aligning with SAP’s focus on Digital Transformation with the launch of SAP Leonardo, including connected manufacturing, digital supply chain, and integrated business planning (IBP), intelligent ERP and connected logistics offerings. There is a good pipeline in place and we should start to see pay-offs of our investments in areas of Digital ERP, benefits of being early adopters of the Leonardo ecosystem, differentiated Industry specific solutions and accelerators. Opportunities for KPIT in SAP continue to grow around HANA, Cloud, Hybris and C4C Solutions.
IMS is gaining good traction in ITSM based Solutions incorporating technologies like ServiceNow, Remedy, Summit etc.
Based on the customer interest, we are developing solutions and offering services in areas such as robotic process automation, Security, Hybrid Enterprise cloud transformation, smart workplace (digital and mobile technologies) and integrated tools stack. Similarly, there is good traction on the Transformation to Cloud scope of services. Customers are participating with us on multiple POC’s additionally as roadmap planning.
Thought Leadership (Business IT)
- KPIT won the Distinguished Partner Award in the 'Process Innovation - Complement JDE with SaaS' category at the 9th Annual Oracle JD Edwards Summit.
The overall digital revenues including ePLM and digital in SAP and Oracle are ~ 41% of the Business IT revenues (41% last quarter) of the company. DT SBU (which addresses DT and ePLM, outside of SAP and Oracle) constituted 14.78% of the total revenue for the quarter with sequential decline of 5.1%.
Promise of cloud, increasing productivity & reliability through Agile, DevOps, Low code / No Code platforms are driving next wave of modernization. KPIT through its Design Thinking workshops & Methodology is helping customers adopt this methodology and achieve pragmatic & design driven solutions. KPIT investing in specific solutions, which deliver higher technology value enhanced by AI for Manufacturing & Oil and Gas customers. KPIT with its IntelliAsset platform and Digital tools & accelerators is providing creative & flexible business models, helping customers validate technology & measure benefits; as they drive adoption & global rollouts. KPIT is partnering with customers helping them with Automation roadmap and execution starting from RPA based solutions all the way to intelligent automation.
Connected products is a focus area for manufacturers launching new products to improve product design, customer service, increase support revenues and gain product insights through integration of ERP, MES, PLM, CRM. KPIT has a strong suite of offerings & mature processes and uses a 4M model (Model, Make, Move and Manage) across its Connected and Smart offerings to deliver such solutions.
Thought Leadership
- KPIT participated, and was part of a speaker session on ‘Building a Smarter and Smarter Enterprise with Digital”; at Siemens PLM Europe, held at the Estrel Convention Centre, Berlin, Germany between 29-31 October 2018.
- KPIT was an exhibitor at the AITalk event in Berlin, Germany held between 15-16 November 2018. The delegation, led by KPIT experts showcased the organization’s Intelligent Automation and Digital offerings to potential customers. KPIT, was also part of a speaker session on Intelligent Automation.
PES SBU contributed 43.19% of the total revenue for the quarter, depicting a sequential growth of 6.4%.
- We have seen strong growth in the PES SBU over the last 2 years and expect the trend to continue going forward. From a 9M YTD perspective, the PES SBU has shown a growth of 31.2% which is among the highest in the Industry
- KPIT continues to deliver Industry leading growth in engineering services driven by traction in deep domain expertise in automotive engineering in the areas of Electric Powertrain, Connected Vehicle, Autonomous driving, ADAS etc and increasing growth from our Top Accounts and these strategic customers will drive majority of the growth going forward. KPIT's experience, excellent rapport with customers and differentiated offerings in the above domains is helping us in gaining leadership position in the automotive industry.
Thought Leadership (Engineering)
- KPIT authored article on "Intelligent Charging: Way Forward for EV Push in India" in Auto Tech Review, a leading magazine covering all domains in automotive electronics.
- KPIT inaugurated Technology & Research Centre at Coventry University Technology Park, U.K..
- KPIT forged a Partnership with Udacity – a for-profit educational organization; for Autonomous Vehicle Talent generation
P&P SBU contributed 3.97% to the total revenue for the quarter and it saw a sequential decline of by 9.9%.
- Our Strategy for the Products and Platforms continues to focus only on Software Platforms, Hardware Design and Software Integration with the Hardware. Wherever required, we will work with a hardware partner. This strategy will help us focus on our strength, which is software platforms. This focus, along with a strong hardware partner, if required will help us strengthen our go-to-market. We anticipate this transition to happen over the next 1-2 quarters. Once stabilized, this will reduce quarterly fluctuations and help improve the profitability of this business.
Automotive vertical contributed 50.44% of total revenue for the quarter, registering a Q-o-Q growth of 2.76%.
- Automotive Vertical continues to be one of the fastest growing verticals for us. Green, Autonomous and Connected are the mega trends in this vertical. 90%+ of the product innovations in new feature development are driven by electronics. With the increasing focus on electric vehicles and autonomous features, newer OEMs and ecosystem partnerships are increasing. Other trends in the Automotive Industry are personal transport to mass mobility, increasing regulatory requirements which provide additional areas of growth in the future.
- ADAS, Electric Powertrain, Diagnostics and AUTOSAR are the key areas of traction in the automotive vertical for us. We are engaging with customers in these strategic areas. We continue to build leadership, domain expertise and drive innovation in these key areas. KPIT is positioned as solutions provider with scalability to leverage OEMs willing to source software independently in Systems/software engineering, integration and validation and Modular product/platform solutions. We are investing in regional development centers and increasing our focus on global hiring of specific domain skills to further strengthen our positioning in this vertical.
Manufacturing vertical contributed 25.93% of total revenue for the quarter, depicting a Q-o-Q decline of 6.28%.
- The Life Sciences industry is witnessing transformational changes, leading to newer areas of technology led investments. IOT programs, especially in medical devices, compliance driven areas such as track and trace, MDM and PLM serve as good growth opportunities for KPIT. Connected patient initiatives are helping caregivers remotely monitor patient health and improve healthcare. Life sciences Industry will be increasing digitally driven and is rapidly adopting cloud related technologies leading to faster operationalization of industry trends.
- The Consumer and Industrial Goods Industry continues to face cost and competitive pressures and faster new-age technology adoptions can be key source of differentiation as well as improved long term profitability for the Industry, Companies are adopting digital solutions such as AI /Machine learning driven shop floor predictive analytics, which helps achieve asset optimization and lower maintenance costs, resulting in improved operational efficiency. KPIT seeks to transform these organizations’ technology at its core and assist them keep pace in a fast-changing business environment.
- High Tech companies, operating on the cutting edge of technology, are expected to face some headwinds, given new developments around trade wars and protectionist measures by governments of developed markets. The industry has also been witnessing a lot of consolidation through M&A.
Energy vertical contributed 13.16% of the total revenue for the quarter depicting a sequential growth of 0.19%.
- The economic uncertainties and changing market dynamics in the Energy industry create several challenges and related opportunities. Companies are facing pressures related to margins and regulatory compliance, scarcity of resources and skilled people, and increasing operational costs, among others. KPIT provides ways to modernize business processes, better connect systems with newer technologies, gain insights for quick and better decision making, and optimally utilize resources and skills. Energy vertical has unique requirements for supply chain, contracts, procurement, material planning, asset management and revenue accounting. Technologies that can bring a transformational change to the business span Cloud, Mobility, Internet of Things (IoT), Big Data and Analytics, PLM, M2M, GIS, Product and Portfolio Management, Asset Management, RFID and Barcoding, High Performance Computing, End User Computing, Portals, In-memory Database, Robotics/Drones, ERP, Social Media/Collaboration, CRM, and Modern Supply Chain solutions, among others.
- The US Geography continues to be the largest geography for us with a revenue share of 59.27% and it declined by 6.13% on a Q-o-Q basis, mainly due to lower billing days and project closures. We see an upward traction on the pipeline. We could complete large transformational programs in the US successfully, The growth forward will be driven from life sciences and Energy related customers followed by CPG and Hitech. There is strong traction in engineering services seen with good wins. On the business IT side, we see improved demand for SAP S/4, Oracle cloud and Infor platforms. Though the challenges on the Visa front continue, we have been successful to augment and build our local development centers. We have hired strong local capabilities in our Detroit and Rayleigh centers for both Engineering and IT skills.
- Europe geography with a revenue share of 26.44%, grew by 13.08% sequentially during this quarter. Europe has been at the forefront of growth for us, led by Investments in Auto engineering in Germany. Though Germany has seen a moderation of economic growth in the near term, the areas we work on are long term investment plays and there would be continued robust investments, which will help sustain our growth over a long period. In Engineering, we see greater opportunities in AD-ADAS, ePowertrain, Infotainment and AUTOSAR, whereas in Business IT the major areas of traction are Digital Technologies, Infor and IMS. We continue to invest in our local delivery center in Munich to provide best in class solutions to our customers with a near shore presence and integrated global delivery model.
- During this quarter, we saw a decline of 9.86% in Asia geography with a revenue share of 14.3%. We could see good traction for us around ‘Mobility’ and ‘Electric Vehicles’ market out of ASEAN region in Asia. Multiple countries in ASEAN region are looking at new ‘National Car’ programs and most of these initiatives are around Electric Vehicle platforms where KPIT can play a significant role as ‘Technology partner’. We are working on some large deals in the Asian geography and expect closure on a few of them in the coming quarters.
*All the revenue growth numbers mentioned under IBU, Geography and SBU update are in equivalent $ terms.
- We have filed 5 patents during the quarter in areas automotive (ADAS) domain, Autonomous Vehicle, Fuel cell and Electric Vehicle. We had filed for 58 unique patents as of end of Q2FY18. In the interim we have dropped 23 of our unique patent filings. Thus, as of Q3FY19 we have filed for 40 unique patents (33 with complete specifications and 7 with Provisional specifications)
- We were also granted 1 patent during this quarter taking the total count of granted patents to 46 across geographies (The same patent if granted in 2 geographies is counted as 2 granted patents). The details of granted patent in Q3 FY19 is mentioned below:
| Patent Number | Patent Title | Country | Domain |
| IN302847 | Method of Converting Vehicle into Hybrid Vehicle | India | Hybrid |
- A global car-maker chose KPIT for its expertise in the Autonomous Driving space; considering our comprehensive AD and ADAS solutions.
- An American multinational corporation providing specialized service and solutions in the Oil & Gas industry chose KPIT for a JD Edwards rollout project.
- A North American based, global provider of engineered industrial solutions and aftermarket solutions to various industries chose KPIT for a CPQ & JD Edwards integration project.
- A leading multinational Bus-maker engaged with KPIT in the eMEDS space.
- A leading Tier1 selected KPIT as its strategic engagement partner in the Vehicle Systems space.
- The India operations of a retail giant, headquartered in Denmark chose KPIT for SAP Migration, AMS projects.
- KPIT won a major deal with a leading Tier1 in the Powertrain space.
- KPIT won a major telematics deal with a leading German Commercial Vehicle (CV) OEM for hardware, in India.
- A North America-based analytical solutions provider chose KPIT for an AMS project.
- KPIT was selected by a renowned America-based franchised distributor of a Japanese automotive brand, for an SAP S/4HANA implementation project.
- An American software company specializing in software for CRM, digital process automation chose KPIT for an SAP Ariba implementation project.
Revenue Update
Profitability
| Details | Rs. Million |
| Cash Profit for Q3 FY19 | 933 |
| Working Capital Adjustments | (1,159) |
| Cash Generated from Operations | (225) |
| Fixed Assets | (292) |
| Balance Cash Flow | (518) |
| Investment in Subsidiary | (150) |
| Debt Repayment | (117) |
| Total Increase/(Decrease) in cash balance | (785) |
| Total Net Cash balance as at Q3 FY19 end | (2,644) |
- The Cash Balance as at December 31, 2018 stood at ₹5,311 Million (₹6,096 Million as on September 30, 2018).
- The DSO were at 84 days, at the quarter end.
- As on December 31, 2018 our total debt stood at ₹2,667 Million (₹2,793 Million as of September 30, 2018) comprising of ₹868.57 Million of Term Loan and ₹1,798.43 Million of Working Capital Loan.
- Thus, the Net Cash Balance as at December 31, 2018 stood at ₹2,644 Million (₹3,303 Million as on September 30, 2018).
|
₹ million |
Q3 FY19 |
Q2 FY19 |
Q-o-Q Growth |
Q2 FY18 |
Y-o-Y Growth |
|
Sales |
10,613.18 |
10,788.69 |
(1.63%) |
9,127.66 |
16.27% |
|
Employee Benefit Expenses |
6,614.73 |
6,450.91 |
2.54% |
5,707.63 |
15.89% |
|
Cost of materials consumed |
9.92 |
16.16 |
(38.61%) |
62.63 |
-84.16% |
|
Depreciation & Amortization Expenses |
287.47 |
367.73 |
(21.83%) |
203.61 |
41.19% |
|
Other Expenses |
2,767.73 |
2,855.78 |
(3.08%) |
2,368.29 |
16.87% |
|
Total Expenses |
9,679.85 |
9,690.58 |
(0.11%) |
8,342.16 |
16.04% |
|
Profit before Other Income, Finance costs & Exceptional Item |
933.33 |
1,098.11 |
(15.01%) |
785.50 |
18.82% |
|
Other Income |
2.61 |
70.01 |
(96.27%) |
25.37 |
(89.71%) |
|
Profit before Finance costs & exceptional Items |
935.94 |
1,168.12 |
(19.88%) |
810.87 |
15.42% |
|
Finance costs |
51.49 |
56.59 |
(9.01%) |
24.27 |
112.15% |
|
Profit after Finance costs & before exceptional Items |
884.45 |
1,111.53 |
(20.43%) |
786.60 |
12.44% |
|
Exceptional Items |
- |
- |
- |
- |
- |
|
Profit Before Tax |
884.45 |
1,111.53 |
(20.4%) |
786.60 |
12.44% |
|
Tax Expenses |
228.34 |
235.13 |
(2.89%) |
167.58 |
36.26% |
|
Net Profit from ordinary activities after Tax |
656.11 |
876.40 |
(25.14%) |
619.02 |
5.99% |
|
Extraordinary Items |
- |
- |
- |
- |
- |
|
Net Profit for the Period |
656.11 |
876.40 |
(25.14%) |
619.02 |
5.99% |
|
Share of profit from associate |
(6.78) |
(50.68) |
- |
- |
- |
|
Minority Interest |
10.18 |
5.13 |
98.44% |
2.24 |
354.46% |
|
PAT |
639.15 |
820.59 |
(22.1%) |
616.78 |
3.63% |
|
Other Comprehensive Income |
(346.28) |
444.07 |
- |
(98.72) |
- |
|
Total Comprehensive income for the period |
292.87 |
1,264.66 |
(76.84%) |
518.06 |
(43.47%) |
|
Paid up Capital |
382.94 |
381.29 |
0.43% |
378.03 |
1.30% |
|
EPS (₹ 2/-Face Value each) |
|
|
|
|
|
|
-Basic |
3.28 |
4.23 |
(22.46%) |
3.20 |
2.50% |
|
- Fully Diluted |
3.21 |
4.11 |
(21.90%) |
3.10 |
3.55% |
|
Common Size Analysis: |
|
|
|
|
|
|
Gross Profit Margin |
30.74% |
33.33% |
(2.59%) |
30.71% |
0.03% |
|
SG&A / Revenue |
17.68% |
19.74% |
(2.06%) |
19.87% |
(2.19%) |
|
EBITDA Margin |
13.00% |
13.59% |
(0.59%) |
10.84% |
2.16% |
|
Net Profit Margin |
6.02% |
7.61% |
(1.59%) |
6.76% |
(0.74%) |
|
₹ million |
9M FY19 |
9M FY18 |
Y-o-Y Growth |
|
Sales |
31,540.27 |
26,991.50 |
16.85% |
|
Employee Benefit Expenses |
19,376.37 |
16,832.84 |
15.11% |
|
Cost of materials consumed |
76.2 |
365.66 |
(79.16)% |
|
Depreciation & Amortization Expenses |
925.68 |
586.59 |
57.81% |
|
Other Expenses |
8,172.78 |
7,087.40 |
15.31% |
|
Total Expenses |
28,551.03 |
24,891.33 |
14.70% |
|
Profit before Other Income, Finance costs & Exceptional Item |
2,989.24 |
2,100.17 |
42.33% |
|
Other Income |
234.66 |
259.90 |
(9.71)% |
|
Profit before Finance costs & exceptional Items |
3,223.90 |
2,360.07 |
36.60% |
|
Finance costs |
161.67 |
75.77 |
113.37% |
|
Profit after Finance costs & before exceptional Items |
3,062.23 |
2,284.3 |
34.06% |
|
Exceptional Items |
- |
25.55 |
- |
|
Share of profit from associate |
(97.06) |
- |
- |
|
Profit Before Tax |
2,965.17 |
2,309.85 |
28.37% |
|
Tax Expenses |
704.17 |
532.16 |
32.32% |
|
Net Profit from ordinary activities after Tax |
2,261.00 |
1,777.69 |
27.19% |
|
Extraordinary Items |
- |
- |
- |
|
Net Profit for the Period |
2,261.00 |
1,777.69 |
27.19% |
|
Minority Interest |
26.93 |
9.18 |
193.36% |
|
PAT |
2,234.07 |
1,768.51 |
26.32% |
|
Other Comprehensive Income |
298.44 |
32.89 |
- |
|
Total Comprehensive income for the period |
2,532.51 |
1,801.40 |
40.59% |
|
Paid up Capital |
382.94 |
378.03 |
1.3% |
|
EPS (₹2/-Face Value each) |
|
|
|
|
- Basic |
11.50 |
9.19 |
25.35% |
|
- Fully Diluted |
11.19 |
8.88 |
25.90% |
|
Common Size Analysis: |
|
|
|
|
EBITDA Margin |
12.92% |
9.95% |
2.97% |
|
Net Profit Margin |
7.08% |
6.55% |
0.53% |
|
|
Q3 FY19 |
Q2 FY19 |
Q-o-Q Growth |
Q3 FY18 |
Y-o-Y Growth |
|
Revenue Spread – Geography |
|
|
|
|
|
|
USA |
59.27% |
61.67% |
(5.46%) |
63.68% |
8.22% |
|
Europe |
26.44% |
22.84% |
13.88% |
19.88% |
54.64% |
|
Rest of World |
14.30% |
15.49% |
(9.22%) |
16.45% |
1.09% |
|
Revenue Spread – Verticals |
|
|
|
|
|
|
Automotive & Transportation |
50.44% |
47.95% |
3.49% |
44.72% |
31.17% |
|
Manufacturing |
25.93% |
27.03% |
(5.61%) |
28.60% |
5.41% |
|
Energy & Utilities |
16.73% |
18.14% |
(9.25%) |
18.31% |
6.25% |
|
Others |
6.89% |
6.89% |
(1.54%) |
8.37% |
(4.25%) |
|
Revenue Spread – by SBU* |
|
|
|
|
|
|
Integrated Enterprise Solutions |
23.78% |
23.81% |
(1.75%) |
26.88% |
2.84% |
|
Product Engineering Services |
43.20% |
39.66% |
7.15% |
34.50% |
45.60% |
|
Products & Platforms |
3.96% |
4.30% |
(9.21%) |
3.84% |
20.03% |
|
SAP |
14.28% |
17.02% |
(17.48%) |
19.98% |
(16.93%) |
|
Digital Transformation^ |
14.78% |
15.22% |
(4.44%) |
14.79% |
16.17% |
|
Customer details |
|
|
|
|
|
|
No. of Customers Added |
3 |
4 |
- |
3 |
- |
|
No. of Active Customers |
251 |
248 |
- |
237 |
- |
|
Customers with run rate of >$1Mn |
96 |
93 |
- |
92 |
- |
|
Strategic Top 20 Clients |
49.87% |
48.68% |
0.78% |
42.90% |
35.17% |
|
Strategic Top 40 Clients |
64.11% |
64.61% |
(2.38%) |
61.25% |
21.71% |
|
Onsite / Offshore Split |
|
|
|
|
|
|
Onsite Revenues |
56.35% |
54.13% |
2.41% |
55.96% |
17.09% |
|
Offshore Revenue |
43.46% |
45.76% |
(6.57%) |
43.19% |
17.00% |
|
SI# |
0.19% |
0.11% |
69.92% |
0.85% |
(74.01%) |
|
Revenue by Contract Type |
|
|
|
|
|
|
Time and Material Basis |
55.82% |
56.87% |
(3.45%) |
61.11% |
6.19% |
|
Fixed Price / Time Basis |
43.99% |
43.02% |
0.60% |
38.04% |
34.48% |
|
SI# |
0.19% |
0.11% |
69.92% |
0.85% |
(74.01%) |
|
Debtors (days) |
84 |
77 |
- |
71 |
- |
|
Human Resources – Details |
Q3 FY19 |
Q2 FY19 |
Q-o-Q Growth |
Q3 FY18 |
Y-o-Y Growth |
|
Development Team – Onsite(Avg.) |
2,089 |
1,886 |
- |
1,762 |
- |
|
Development Team - Offshore(Avg.) |
10,353 |
10,251 |
- |
9,438 |
- |
|
Onsite FTE |
1,883 |
1,775 |
6.06% |
1,643 |
14.55% |
|
Offshore FTE |
7,255 |
7,459 |
-2.72% |
6,683 |
8.56% |
|
Total FTE |
9,138 |
9,234 |
-1.04% |
8,326 |
9.75% |
|
Development (at Quarter end) |
12,654 |
12,244 |
- |
11,234 |
- |
|
Gen Management / Support (at Quarter end) |
665 |
663 |
- |
636 |
- |
|
Marketing (Subsidiaries)(at Quarter end) |
265 |
262 |
- |
251 |
- |
|
Total (at Quarter end) |
13,584 |
13,169 |
- |
12,211 |
- |
|
Onsite utilization |
90.12% |
94.12% |
- |
93.27% |
- |
|
Offshore utilization |
70.08% |
72.76% |
- |
70.81% |
- |
- Total amount of USD hedges as on 31st December 2018 : $ 43.05 Million
- These hedges are maturing in the next 2 quarters and average rate for these hedges is ₹72.43 /$
|
Balance Sheet Summary: As at (₹ Million) |
Dec 31, 2018 |
Sep 30, 2018 |
|
Assets: |
|
|
|
Non-current Assets: |
10,925.91 |
11,086.15 |
|
Fixed Assets |
4,469.17 |
4,464.27 |
|
Goodwill |
4,445.89 |
4,613.11 |
|
Other Non-current assets |
2,010.85 |
2,008.77 |
|
Current Assets: |
18,344.55 |
18,401.73 |
|
Inventories |
168.85 |
151.93 |
|
Trade Receivables |
10,360.32 |
9,827.45 |
|
Cash & bank balances |
4,943.89 |
4,261.03 |
|
Other Current Assets |
2,871.49 |
4,161.32 |
|
Total Assets |
29,270.46 |
29,487.88 |
|
Equity & Liabilities: |
|
|
|
Equity: |
20,250.59 |
20,025.36 |
|
Share Capital |
382.94 |
381.29 |
|
Other Equity |
19,835.76 |
19,589.27 |
|
Non-controlling Interest |
31.89 |
54.80 |
|
Non-current Liabilities: |
1,583.29 |
1,541.08 |
|
Financial liabilities |
843.43 |
737.72 |
|
Provisions |
739.20 |
800.72 |
|
Deferred tax liabilities |
0.66 |
2.64 |
|
Current Liabilities: |
7,436.58 |
7,921.44 |
|
Short term borrowings |
1,781.44 |
1,874.76 |
|
Trade Payables |
1,774.19 |
1,488.32 |
|
Other Current liabilities |
3,880.95 |
4,558.36 |
|
Total Equity & Liabilities |
29,270.46 |
29,487.88 |
KPIT (BSE:532400, NSE: KPIT) is a global technology company specializing in providing IT Consulting and Product Engineering solutions and services to Automotive, Manufacturing, Energy & Utilities and Life Sciencescompanies. Together with its customers and partners, it creates and delivers technologies to enable creating a cleaner, greener and more intelligent world that is sustainable and efficient.
Some of the statements in this update that are not historical facts are forward-looking statements. These forward-looking statements include our financial and growth projections as well as statements concerning our plans, strategies, intentions and beliefs concerning our business and the markets in which we operate. These statements are based on information currently available to us, and we assume no obligation to update these statements as circumstances change. There are risks and uncertainties that could cause actual events to differ materially from these forward-looking statements. These risks include, but are not limited to, the level of market demand for our services, the highly-competitive market for the types of services that we offer, market conditions that could cause our customers to reduce Their spending for our services, our ability to create, acquire and build new businesses and to grow our existing businesses, our ability to attract and retain qualified personnel, currency fluctuations and market conditions in India and elsewhere around the world, and other risks not specifically mentioned herein but those that are common to industry.
Write to our representatives